Logged on 06/29/2009 12:15:39 PM
This first PURR log will describe how the first, simple open challenge is generated. Subsequent PURR logs describing the more complex simulations may not repeat the steps which are described in this one, so it's worth reading this one even if you laugh in the face of the simplicity of the simulation.
I'd like to add a disclaimer as well: this log isn't a general introduction and might be incomplete in places. I'm assuming some familiarity with MeqTrees and Measurement Sets.
Ingredients:
- MeqTrees: http://www.astron.nl/meqwiki
- MakeMS: http://www.astron.nl/meqwiki/BuildingMakeMs
- Python with Pyrap: http://code.google.com/p/pyrap
- PURR: http://www.astron.nl/meqwiki/OlegSmirnov/PurrInstallationNotes
- A FITS viewer: http://www.atnf.csiro.au/computing/software/karma
Logged on 06/29/2009 12:21:28 PM
For MeqTrees to perform a simulation it needs an empty Measurement Set. This consists of antenna information, a central pointing direction, frequency channel information and the empty UVW points. MeqTrees will generate (corrupted) visibilities based on your sky model and fill up one or more of the data columns of the MS.
An empty MS can be generated in several ways. My old method of choice was to use the AIPS++ simulator to observe a blank sky, but the MakeMS tool is much faster.
The only catch is that MakeMS needs an ANTENNA table from an existing MS. For this first example simulation I took the antenna table from the MS of a genuine Westerbork observation. This is attached below. I've got lots of different ANTENNA tables lying around so get in touch if you need one.
MakeMS also needs a config file which describes the observation (pointing direction, duration, integration, channel info etc.). This is also provided below.
As you can see from the config file we're simulating a 12 hour observation with 3 minutes of integration per visibility. This integration time is probably a bit high but we can keep the file sizes manageable this way and still make a point.
This is a 64 channel L-band observation, looking at RA = 0 and Dec = 60.
A quirk exhibited by MakeMS is that by default it labels all the stations 'LOFAR' and gives them a diameter of 150 m. This won't really affect things as dish sizes are generally wired into the E-Jones modules and the station names are cosmetic.
I've hacked the relevant table using Pyrap Tables (you can also use glish) for this example however, in case you want to write your own super E-Jones module which pulls the relevant info out of the table.
But I'm getting ahead of myself here...
Logged on 06/29/2009 12:29:05 PM
This first simulation will be as simple as possible. The sky will consist of a single 10 Jy point source (i.e. a typical "Cat-I" source) at the field centre. The source is unpolarised and is spectrally flat.
I'm building a Local Sky Model from a text file (h m s, d m s format). For a description of the columns in this file refer to line 1954 of the Cattery/LSM/LSM.py script.
Logged on 06/29/2009 12:31:56 PM
Most of the initial set of open simulations can be generated using the example-sim.py TDL script which is part of the Siamese Framework. If I use any TDL scripts which aren't bundled with the Cattery they'll be added to the PURR log.
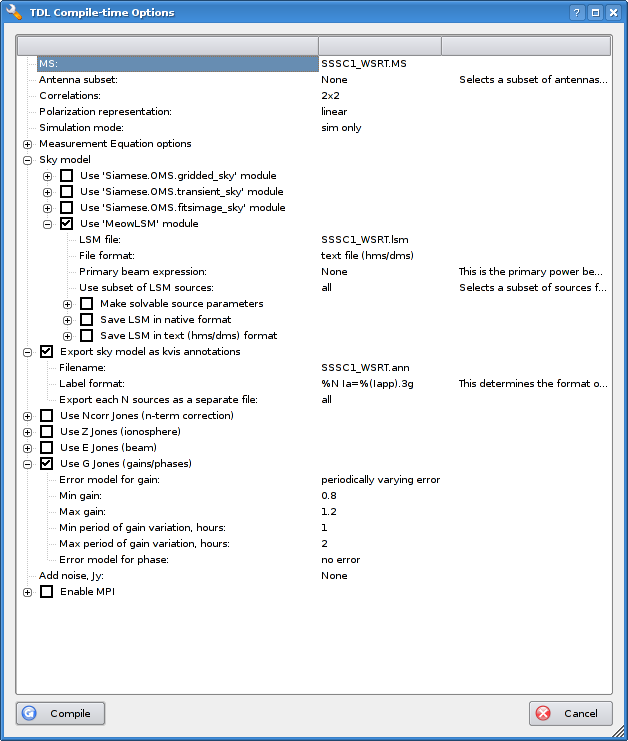
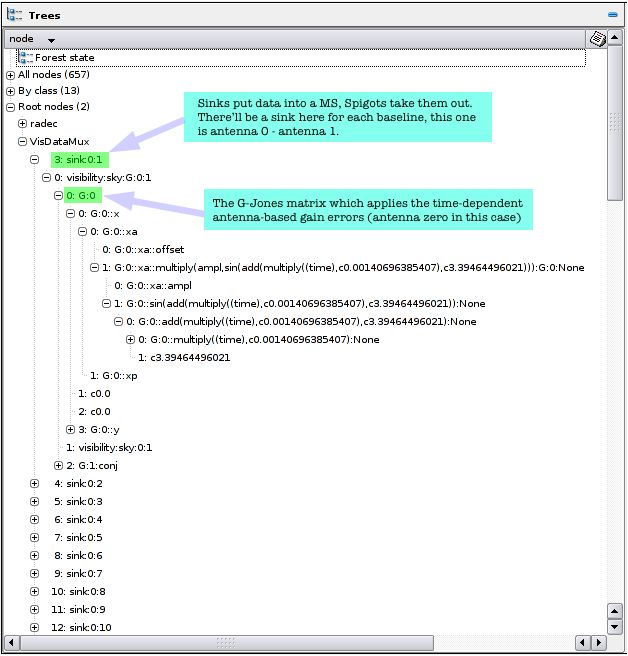
Load the TDL script and set up the compile time options as per the screenshot below. For this first simulation all we'll do is give it the sky model and then apply the G-Jones option to corrupt the data with slowly varying antenna gain errors at the +/- 20% level. We'll also generate a kvis-compatible annotation file.
Press 'compile' and this will take a couple of seconds to build the tree. It will also generate the Karma annotation file which is included in the data products below.
|
|
|
|
Logged on 06/29/2009 12:49:01 PM
Normally at this point we could just hit the 'simulate MS' button and it would fill up the MS with the simulated visibilities. This is a brand new MS however, so before that can happen we need to initialise a few columns that MakeMS does not generate, i.e. the model_ and corrected_data column and the imaging weights column.
This can be done by invoking the imager.
At the run time options menu set up the imaging options as shown below and hit "make a dirty image".
The imager should run in the background and initialise the required columns before returning an image. This image will contain garbage, so just ignore it.
 |
Logged on 06/29/2009 01:00:47 PM
If all went well then the imager should have run in the background, it will have hopefully invoked your FITS viewer and you will have seen an image.
Close the viewer, return to the MeqBrowser and click the 'TDL Exec' button to bring up the runtime options.
I'm going to write the visibilities to the DATA column of this MS, so select 'custom' for the 'Output MS column' option and enter 'DATA'.
It's worth noting that whatever column you have selected will be overwritten or modified without warning and without an undo button as soon as you click the 'simulate MS' button.
Once you do click this button it will execute the tree.
Now let's image the simulation. Click the 'TDL Exec' button and set up the imaging options as show below. We're averaging all the channels here and imaging a half-degree field. If all's gone well then you should see the image below.
This simulated Measurement Set is open challenge number 1.
 |
||||||||||||||||
|
|
|||||||||||||||


