 |  |
 |
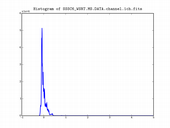
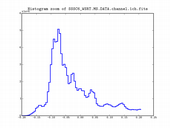
| data range: | -0.198714,4.98532 |
| size: | 1x1x1024x1024 |
| mean: | -0.00615919 |
| sigma: | 0.122619 |
| clipping: | 95% |
| clip range: | -0.198714,0.211351 |
Logged on 06/30/2009 04:19:40 PM
The WSRT records polarization in X and Y and produces four correlation products: XX XY YX YY.
For the simulations with unpolarized sources we've been assigning the source brightness solely to I and leave Q, U and V equal to zero.
The correlation products reflect this by having half the flux in XX, the other half in YY and nothing in the cross products.
For this first example we use a linearly polarized wave (i.e. V = 0), which is completely vertically polarized (i.e. psi = 0, Q = a positive value, U = 0).
The attached LSM in the data products below is the same as SSSC1 but with the Q value edited to be 10.0 Jy.
Logged on 06/30/2009 04:25:59 PM
As per SSSC1 we build the tree, initialise the data columns by invoking the imager and then execute the tree to simulate the visibilities.
Examine the compile time options below, things are much the same as they were for SSSC1. Note that we're also retaining the G(t) Jones which corrupts the receiver gains.
 |
||||||||||||||||
|
|
|||||||||||||||
Logged on 06/30/2009 04:28:57 PM
The plot below shows the visibility amplitude as a function of baseline length. As you can see this source has registered only in the XX polarization. YY is zero, as are the cross products.
 |