 |  |
 |
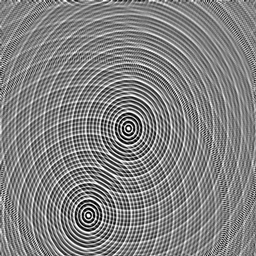
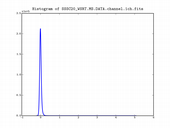
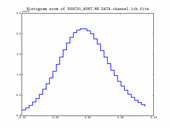
| data range: | -0.212974,5.08159 |
| size: | 1x1x2048x2048 |
| mean: | 1.6591e-05 |
| sigma: | 0.0483282 |
| clipping: | 95% |
| clip range: | -0.0992235,0.0920839 |
Logged on 07/06/2009 06:15:57 PM
For SSSC20 we simply repeat SSSC19 but put the central 10 Jy point source back in.
Logged on 07/06/2009 06:18:10 PM
Building the tree, executing the tree and then imaging the DATA column should give something along the lines of the image below.
Remember to widen the imaging region, as per SSSC19.
|
|
|||||||||||||||
Logged on 07/06/2009 06:21:58 PM
You can download the FITS image above, download and image the Measurement Set, or better yet attempt the simulation yourself and examine your own data products. In any case if you measure the brightnesses of the sources you'll notice they are the same, just as they are in the LSM file.
An interferometer which could recover the intrinsic fluxes of two sources which are separated by as much as these would be a wonderful thing, however the sources away from the pointing centre are attenuated by the primary beam of the instrument. Their apparent fluxes will be different from their true values.
This can of worms is represented by a matrix known as 'E-Jones', something we'll be seeing in subsequent simulations.