SSSC7

SSSC7


Image the measurement set

Logged on 26/09/09 20:38:05

This is essentially a repeat of the simulation for SSSC6, i.e. a linearly polarized source, but with a polarization angle of 45 degrees.

[I, Q, U, V] fluxes are [10.0, 0.0, 10.0, 0.0].

Using Cattery/Calico/calico-view-ms.py, pointing to the SSSC7 MS file. The imager run-time settings were set up to output all four Stokes parameters (I, Q, U and V) with options as shown. Pressed 'Make a dirty image'.

Data products

SSSC7_WSRT.lsm

.tdl.conf

calico-view-ms-run-time.png

calico-view-ms-run-time.png

SSSC7_WSRT.MS.DATA.channel.1ch.img

SSSC7_WSRT.MS.DATA.channel.1ch.fits (header)

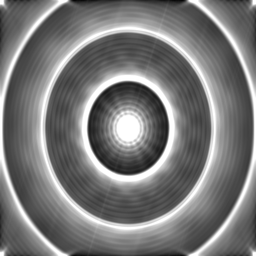
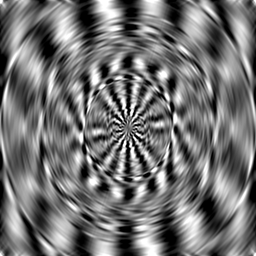
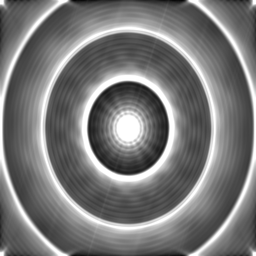
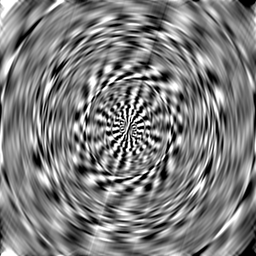
1x4x512x512 FITS cube, 4 planes are given below.

0-full.png

Image plane #0.

data range:-0.212375,4.9933
mean:-0.00595606
sigma:0.122759
clipping:95%
clip range:-0.212375,0.209569
1-full.png

Image plane #1.

data range:-0.0355398,0.0427098
mean:-0.000127491
sigma:0.00857737
clipping:95%
clip range:-0.0154425,0.0187153
2-full.png

Image plane #2.

data range:-0.212074,4.99021
mean:-0.00610868
sigma:0.122663
clipping:95%
clip range:-0.212074,0.209595
3-full.png

Image plane #3.

data range:-0.0302455,0.0298362
mean:-5.97974e-08
sigma:0.00465583
clipping:95%
clip range:-0.00959241,0.00994587

Calibration (G-jones) and imaging of residuals

Logged on 26/09/09 20:46:56

Now using Cattery/Calico/calico-wsrt.py, with compile-time options as below, and using the supplied sky model.

Set up to solve for the G-jones, and then make an image of the residuals. The residual image shows only nJy-noise, indicating that the calibration has worked well.

Data products

calico-wsrt-compile-time.png

calico-wsrt-compile-time.png

calico-wsrt-run-time.png

calico-wsrt-run-time.png

.tdl.conf

calico-wsrt-imaging-options.png

calico-wsrt-imaging-options.png

SSSC7_WSRT.MS.CORRECTED_DATA.channel.1ch.img

SSSC7_WSRT.MS.CORRECTED_DATA.channel.1ch.fits (header)

1x4x512x512 FITS cube, 4 planes are given below.

0-full.png

Image plane #0.

data range:-1.68564e-09,2.10957e-09
mean:2.73618e-11
sigma:4.16483e-10
clipping:95%
clip range:-7.88728e-10,8.45732e-10
1-full.png

Image plane #1.

data range:-2.25268e-09,1.62444e-09
mean:-9.70328e-12
sigma:3.94292e-10
clipping:95%
clip range:-7.60899e-10,8.02825e-10
2-full.png

Image plane #2.

data range:-1.82781e-09,1.68663e-09
mean:3.69739e-13
sigma:4.26783e-10
clipping:95%
clip range:-8.63402e-10,8.14881e-10
3-full.png

Image plane #3.

data range:-1.81255e-09,1.81255e-09
mean:9.39848e-17
sigma:4.03137e-10
clipping:95%
clip range:-8.10693e-10,7.78832e-10

This log was generated by PURR version 1.0.