 | |
| data range: | -0.164755,5.0069 |
| size: | 1x1x1024x1024 |
| mean: | 0.000354857 |
| sigma: | 0.088411 |
| clipping: | 95% |
| clip range: | -0.164755,0.168574 |
Logged on 08/24/2009 01:55:58 PM
The dataset generated in the first part is used for this challange. The program, calico-view-ms.py is used to view the dataset. The viewers can be displayed by selecting items from the bookmarks menu. The options are "Inspect input visibilities" which shows visibilities (amplitude by default) against time for each baseline, and "Input visibilities by baseline" which shows 4 baselines per bookmark and shows real and imaginary by default as frequency against time.
Logged on 08/24/2009 01:59:34 PM
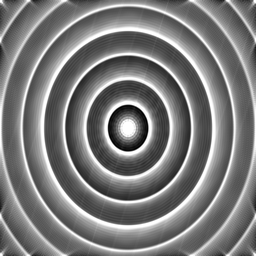
The calico-view-ms program also contains the "make dirty image" option. This runs the lwimager to crate a dirty image of the simulated data. This should be quite similar to wsrt's dirty beam (as it's a point source) but with some corruption
|
|
|||||||||||||||
Logged on 08/24/2009 02:13:05 PM
Next the calico-wsrt.py program is loaded. The option "Subract Sky Model" is selected and the sky model used to generate the MS is selsected. Compiled.
Logged on 08/24/2009 02:16:22 PM
The Generate residuals button was clicked to do the source subraction and generate a residual image. The slowly varying amplitude variations are visibile in the residual image.
|
|
|||||||||||||||
Logged on 08/24/2009 02:21:24 PM
From TDL Options, the Calibrate and 'Correct data or residuals' options were selected as well as Use G-Jones to allow for reciever gains/phase calibration.
Logged on 08/24/2009 02:29:52 PM
Diagonal term calibration is then performed. The gains for each antenna reflect the gains variation that was originally simulated. The amplitude residuals are now flat.
 |
|
 |
Logged on 08/24/2009 02:32:41 PM
When the model is subtracted from the corrected_data the residuals consist only of very low level noise (I don't know were this noise came from, maybe due to floating point arithmetic)
|
|
|||||||||||||||