SSSC7_WSRT.MS.DATA.channel.1ch.fits (header)
1x4x512x512 FITS cube, 4 planes are given below. |
|
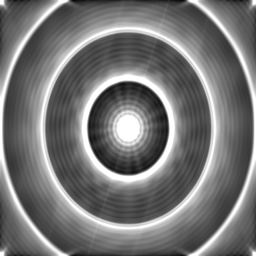
Image plane #0. | data range: | -0.204159,4.99845 |
| mean: | -0.00596457 |
| sigma: | 0.122857 |
| clipping: | 95% |
| clip range: | -0.204159,0.212457 |
|
|
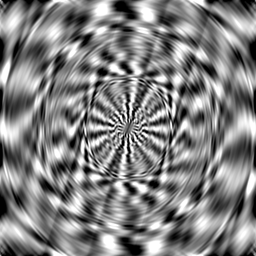
Image plane #1. | data range: | -0.0499474,0.0321995 |
| mean: | -0.000201478 |
| sigma: | 0.00831869 |
| clipping: | 95% |
| clip range: | -0.0163345,0.0155134 |
|
|
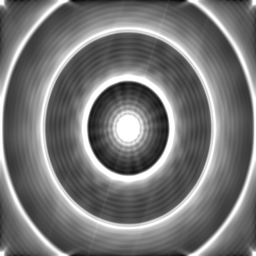
Image plane #2. | data range: | -0.205045,4.99679 |
| mean: | -0.0058132 |
| sigma: | 0.12278 |
| clipping: | 95% |
| clip range: | -0.205045,0.211509 |
|
|
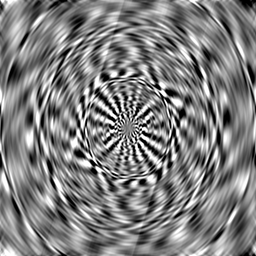
Image plane #3. | data range: | -0.0246787,0.0246787 |
| mean: | -1.49998e-07 |
| sigma: | 0.00460876 |
| clipping: | 95% |
| clip range: | -0.00949551,0.00954371 |
|
SSSC7_WSRT.MS.CORRECTED_DATA.channel.1ch.fits (header)
1x4x512x512 FITS cube, 4 planes are given below. |
|
Image plane #0. | data range: | -0.027363,0.0720199 |
| mean: | 0.000128688 |
| sigma: | 0.00811996 |
| clipping: | 95% |
| clip range: | -0.0161048,0.0146612 |
|
|
Image plane #1. | data range: | -0.0498482,0.032199 |
| mean: | -0.000199748 |
| sigma: | 0.00834612 |
| clipping: | 95% |
| clip range: | -0.0167569,0.0153729 |
|
|
Image plane #2. | data range: | -0.0289559,0.0728483 |
| mean: | 0.000167938 |
| sigma: | 0.00813648 |
| clipping: | 95% |
| clip range: | -0.0134466,0.0190631 |
|
|
Image plane #3. | data range: | -0.0246792,0.0246792 |
| mean: | -2.1171e-09 |
| sigma: | 0.00456789 |
| clipping: | 95% |
| clip range: | -0.00944752,0.00939932 |
|
SSSC7_WSRT.MS.CORRECTED_DATA.channel.1ch.fits (header)
1x4x512x512 FITS cube, 4 planes are given below. |
|
Image plane #0. | data range: | -1.5267e-09,1.70606e-09 |
| mean: | -2.69375e-12 |
| sigma: | 3.98883e-10 |
| clipping: | 95% |
| clip range: | -8.4163e-10,7.33706e-10 |
|
|
Image plane #1. | data range: | -1.85577e-09,2.19367e-09 |
| mean: | 2.30888e-12 |
| sigma: | 4.00406e-10 |
| clipping: | 95% |
| clip range: | -9.06685e-10,7.10719e-10 |
|
|
Image plane #2. | data range: | -1.6928e-09,1.65555e-09 |
| mean: | 2.37765e-11 |
| sigma: | 4.14979e-10 |
| clipping: | 95% |
| clip range: | -8.36095e-10,8.08651e-10 |
|
|
Image plane #3. | data range: | -1.72813e-09,1.72813e-09 |
| mean: | 6.87852e-17 |
| sigma: | 4.06587e-10 |
| clipping: | 95% |
| clip range: | -8.91068e-10,7.39181e-10 |
|


