 |  |
 |
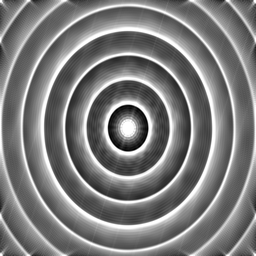
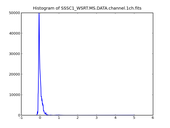
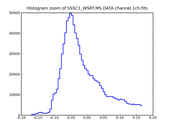
| data range: | -0.169142,5.01046 |
| size: | 1x1x1024x1024 |
| mean: | 0.000327632 |
| sigma: | 0.0890185 |
| clipping: | 95% |
| clip range: | -0.169142,0.169758 |
Logged on 18/08/09 14:46:27
Load TDl Script Cattery/Calico/calico-view-ms.py
Can examine a subset of antennas here, but we'll just leave the defaults.
Logged on 18/08/09 14:52:37
Loading using TDL script Cattery/Calico/calico-view-ms.py
Compile Options: leave as defaults
Logged on 18/08/09 14:58:47
Selected all data.
Bookmarks > Input visibilities by baseline > spigot:0:5 - spigot:0:8 (used this one specifically to match the displayed values with those shown in the image for SSSC1, but any baselines could be used).
Logged on 18/08/09 15:02:23
Expanded 'Make an image from this MS'.
Did not get the option to choose lwimager, which is probably because I don't have any other images installed on this particular machine.
|
|
|||||||||||||||
Logged on 18/08/09 15:06:01
Copied in LSM file that was used in creating this MS.
Logged on 18/08/09 15:09:15
Set to subtract using MeowLSM model. Just subtracting sky model, no residuals or corrections.
Logged on 18/08/09 15:20:41
Subtracted sky model using LSM, using DATA and storing in CORRECTED_DATA.
Then imaged the residuals, using the 'Make a dirty image' action. Average all channels together in this instance, and create a 512 pixel, 30 arcmin image (shown below).
See lots of structure lefy by the gain errors.
|
|
|||||||||||||||
Logged on 18/08/09 15:30:56
Set up to calibrate the data for receiver gain and phase errors (G-Jones).
Solutions shown match the expected result of slowly varying gain errors, and no phase errors.
.purr-products/thumb.png) |
|
.purr-products/thumb.png) |
Logged on 18/08/09 15:34:28
Now that we have calculated the G-Jones, try subtracting the sky model and imaging the residuals (should see noise-like structure at a very low level, since we basically have an exact solution here)
|
|
|||||||||||||||
Logged on 18/08/09 15:44:26
Stewart Gleadow gleadows@unimelb.edu.au MWA Software Engineer University of Melbourne