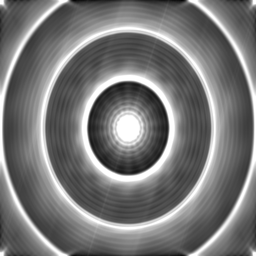
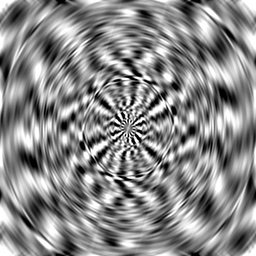
SSSC11_WSRT.MS.DATA.channel.64ch.fits (header)
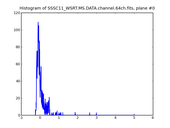
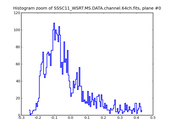
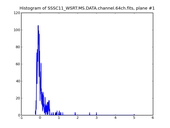
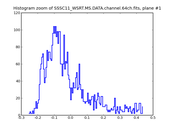
64x1x64x64 FITS cube, 4 planes are given below. |
|
Image plane #0. | data range: | -0.251805,5.00835 |
| mean: | 0.0127977 |
| sigma: | 0.227636 |
| clipping: | 95% |
| clip range: | -0.251805,0.436536 |
|
|
Image plane #1. | data range: | -0.252536,5.00761 |
| mean: | 0.0128857 |
| sigma: | 0.227605 |
| clipping: | 95% |
| clip range: | -0.252536,0.44094 |
|
|
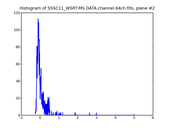
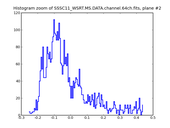
Image plane #2. | data range: | -0.251874,5.00684 |
| mean: | 0.0127661 |
| sigma: | 0.227533 |
| clipping: | 95% |
| clip range: | -0.251874,0.441414 |
|
|
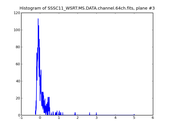
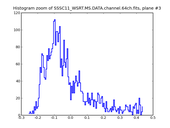
Image plane #3. | data range: | -0.25291,5.00608 |
| mean: | 0.0127421 |
| sigma: | 0.22747 |
| clipping: | 95% |
| clip range: | -0.25291,0.440413 |
|
SSSC11_WSRT.MS.DATA.channel.1ch.fits (header)
1x4x512x512 FITS cube, 4 planes are given below. |
|
Image plane #0. | data range: | -0.209304,4.98427 |
| mean: | -0.00594402 |
| sigma: | 0.122497 |
| clipping: | 95% |
| clip range: | -0.209304,0.211659 |
|
|
Image plane #1. | data range: | -0.0363936,0.062031 |
| mean: | 0.000122313 |
| sigma: | 0.00597322 |
| clipping: | 95% |
| clip range: | -0.0124603,0.0108963 |
|
|
Image plane #2. | data range: | 0,0 |
| mean: | 0 |
| sigma: | 0 |
| clipping: | 95% |
| clip range: | 0,0.000976562 |
|
|
Image plane #3. | data range: | 0,0 |
| mean: | 0 |
| sigma: | 0 |
| clipping: | 95% |
| clip range: | 0,0.000976562 |
|
.tdl.conf |
 |
image_residuals_runtime.png |
SSSC11_WSRT.MS.CORRECTED_DATA.channel.6ch.fits (header)
6x1x512x512 FITS cube, 4 planes are given below. |
|
Image plane #0. | data range: | -1.80411e-09,1.78611e-09 |
| mean: | 9.15097e-12 |
| sigma: | 4.42155e-10 |
| clipping: | 95% |
| clip range: | -7.80335e-10,9.97245e-10 |
|
|
Image plane #1. | data range: | -2.19569e-09,1.63553e-09 |
| mean: | -2.34509e-11 |
| sigma: | 4.26385e-10 |
| clipping: | 95% |
| clip range: | -8.74967e-10,8.04933e-10 |
|
|
Image plane #2. | data range: | -1.89227e-09,2.15074e-09 |
| mean: | 4.15564e-12 |
| sigma: | 4.39546e-10 |
| clipping: | 95% |
| clip range: | -8.97312e-10,8.35974e-10 |
|
|
Image plane #3. | data range: | -2.23571e-09,1.67614e-09 |
| mean: | -1.22862e-12 |
| sigma: | 4.28114e-10 |
| clipping: | 95% |
| clip range: | -7.91688e-10,9.08286e-10 |
|

