Effects of this flaring on the image Effects of this flaring on the image
Logged on 04/02/13 00:39:04
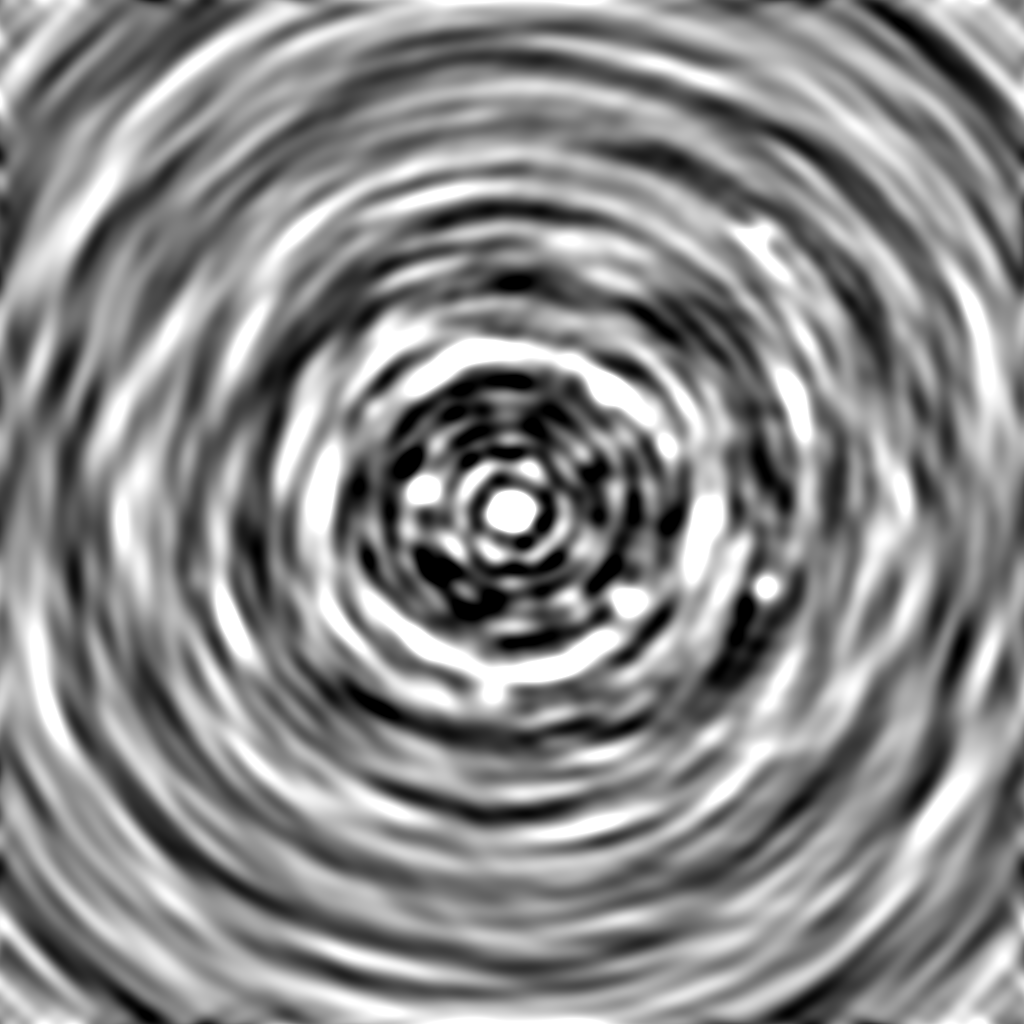
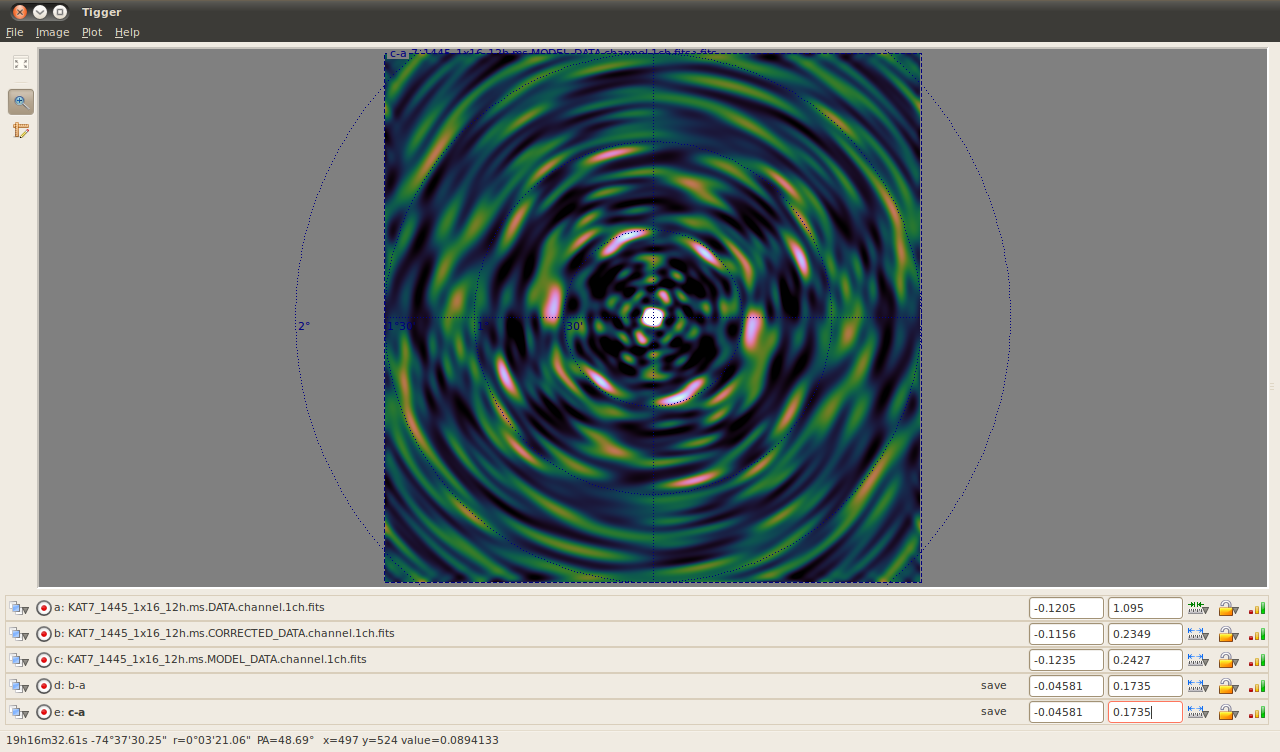
We've now got a Measurement Set that contains the unperturbed sky in the DATA column, a single flare in the CORRECTED column and the double flare scenario in the MODEL column.
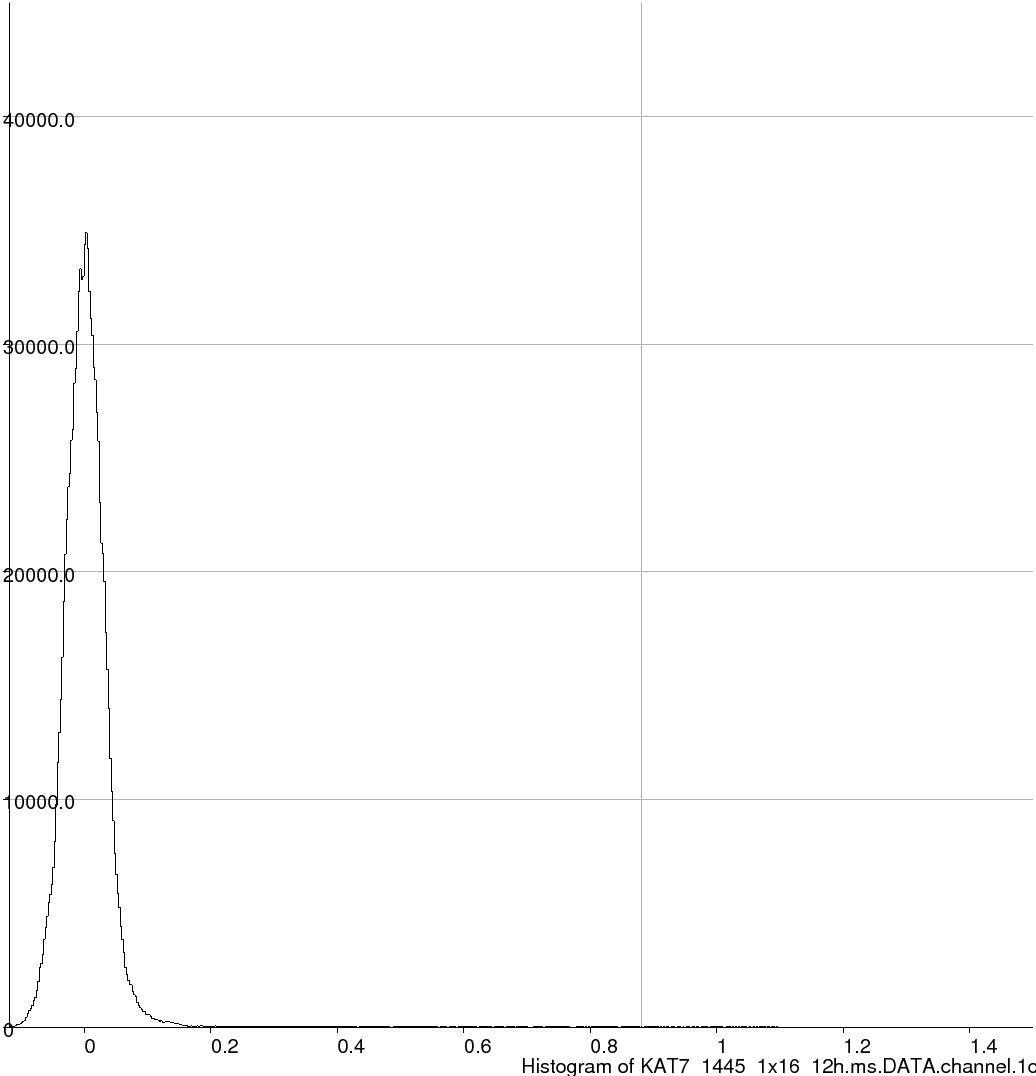
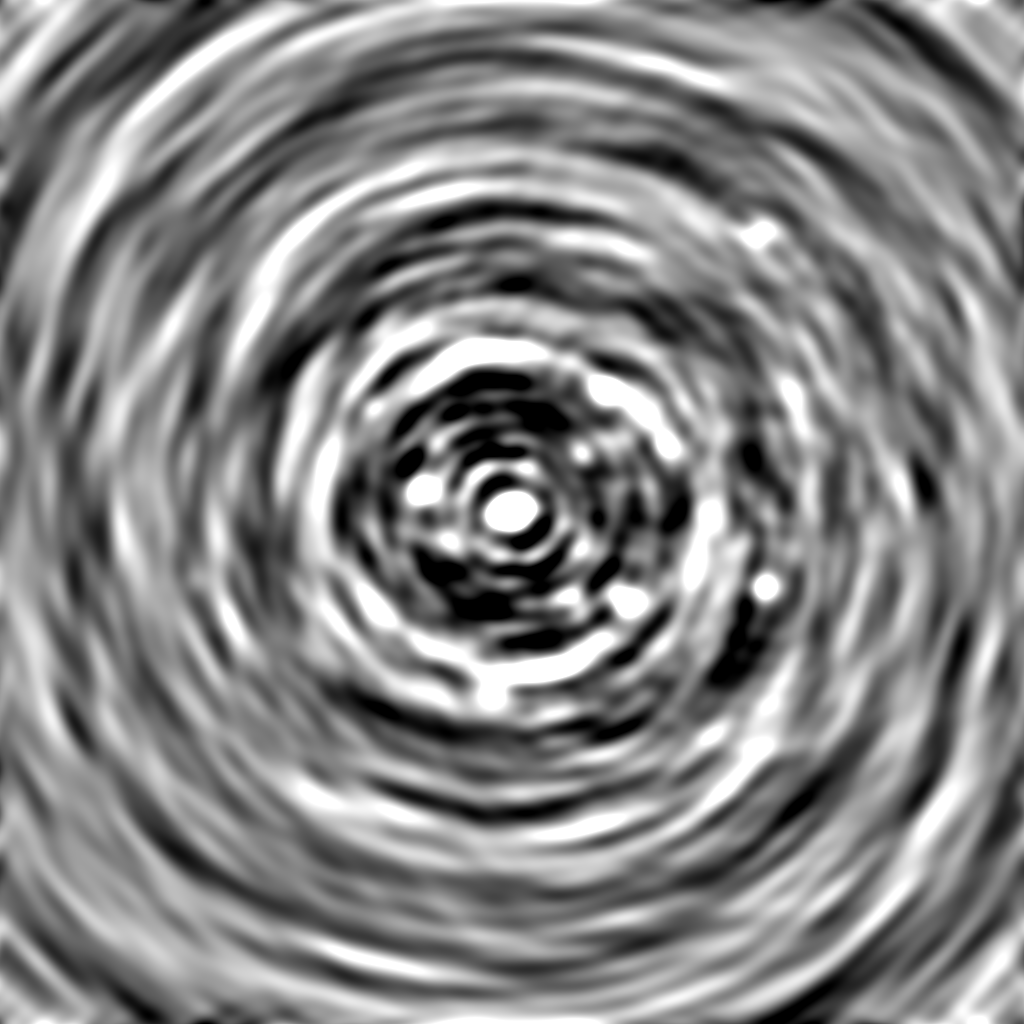
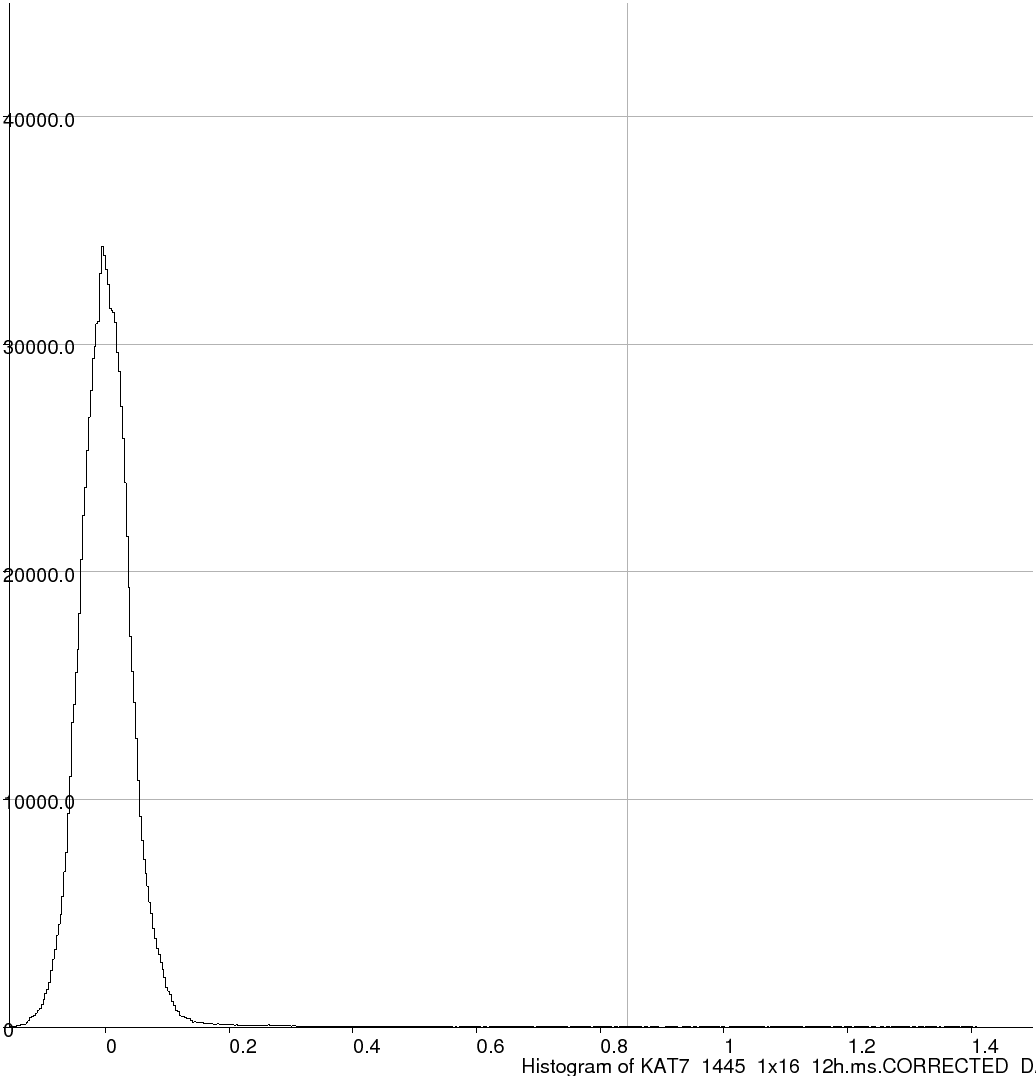
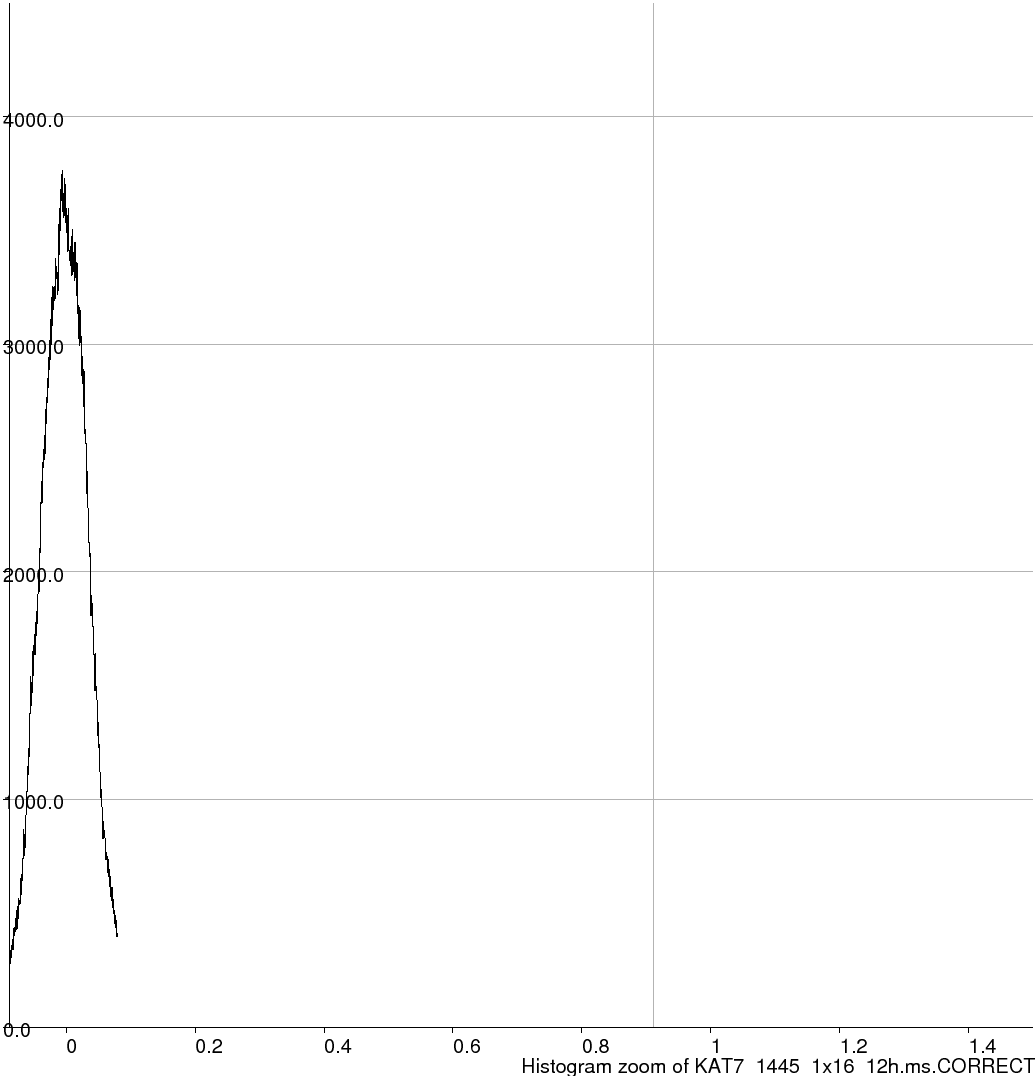
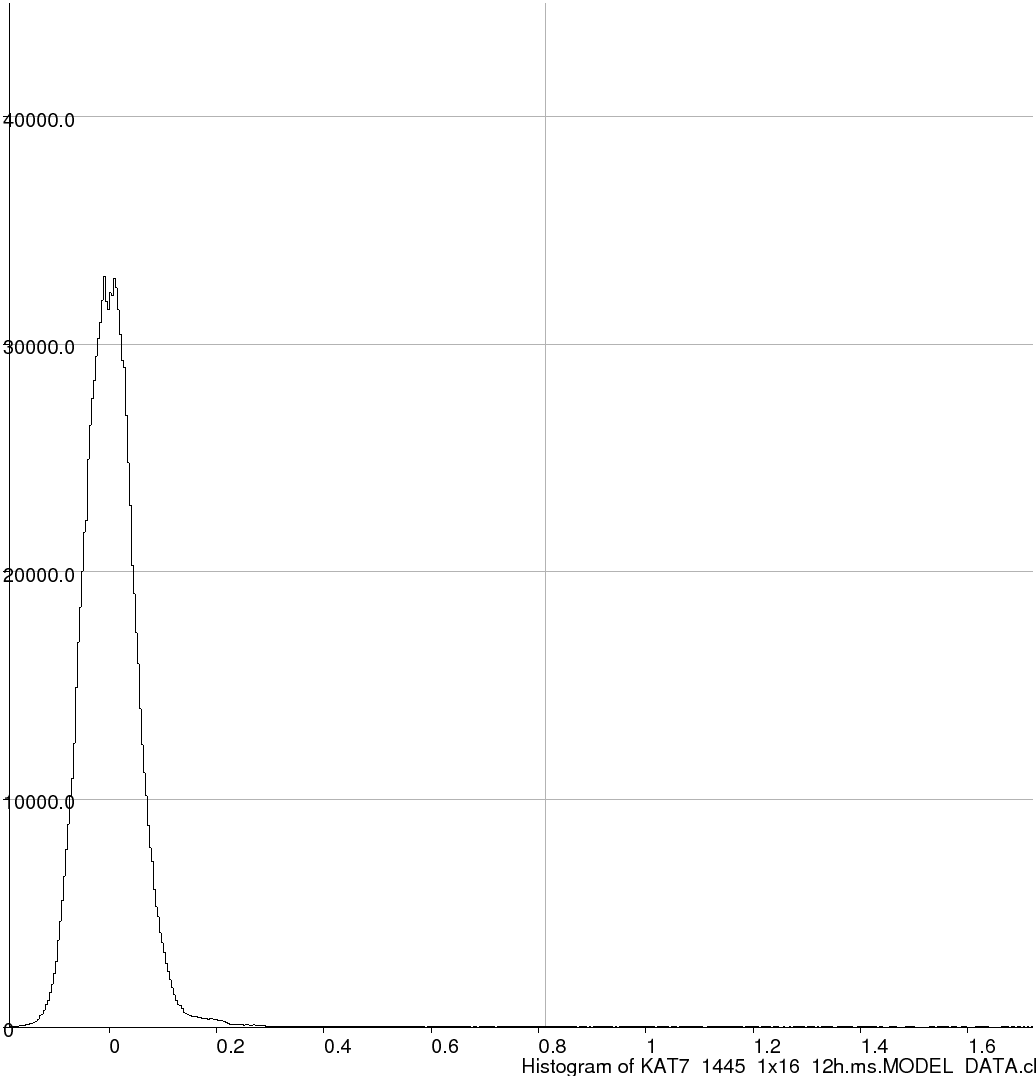
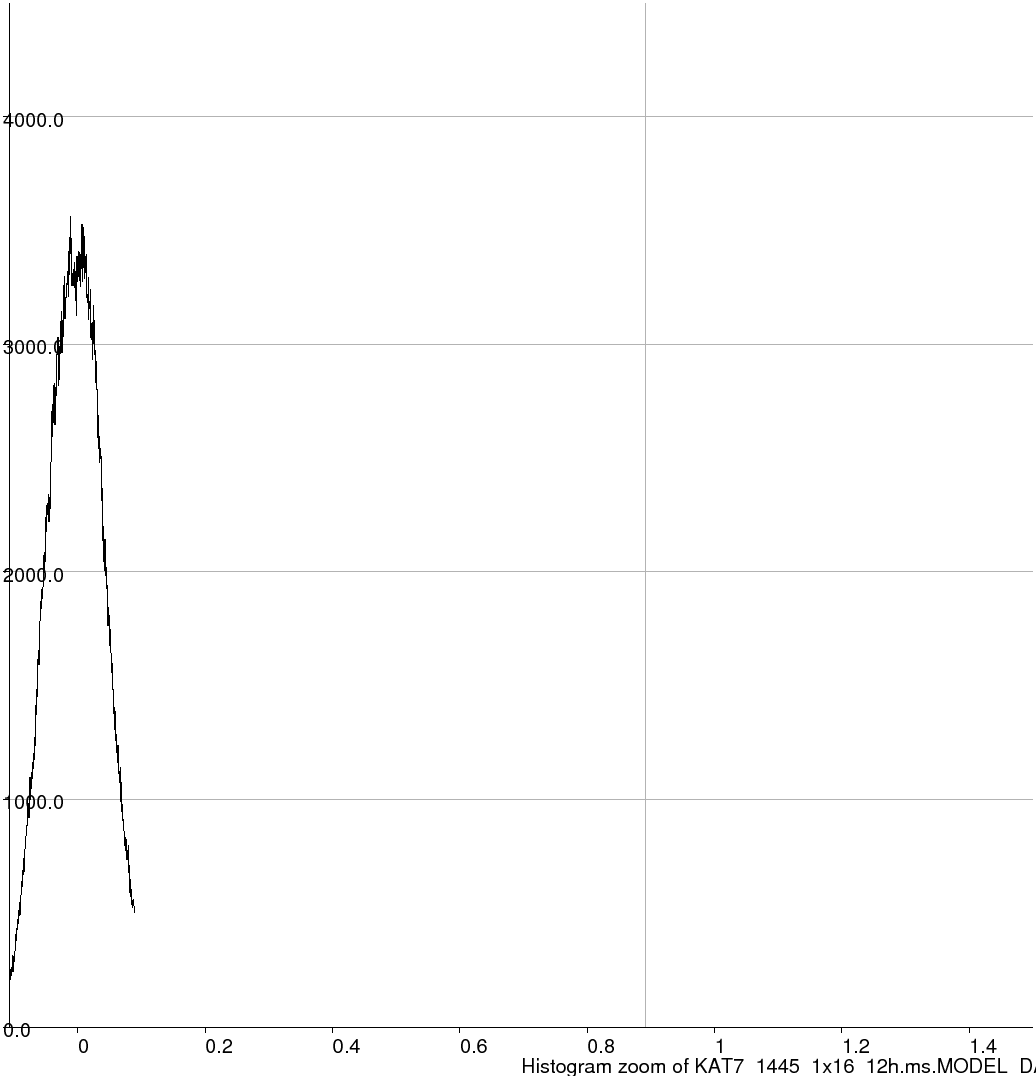
Making an image of all three of these should allow us to see the situation deteriorate. A quick look at the sigma values on the Purr rendering of the FITS images below shows how the situation gets progressively worse. The biggest cause in the increase of these values is the PSF sidelobes associated with the bright source. The sidelobes exist at some fraction of the brightness of the main lobe for the PSF. Times during which source has flared end up with correspondingly higher sidelobes in PSF for those time slots. The PSF associated with this source now differs from the assumed 'analytic' PSF that one obtains by Fourier transforming the Fourier plane sampling pattern.
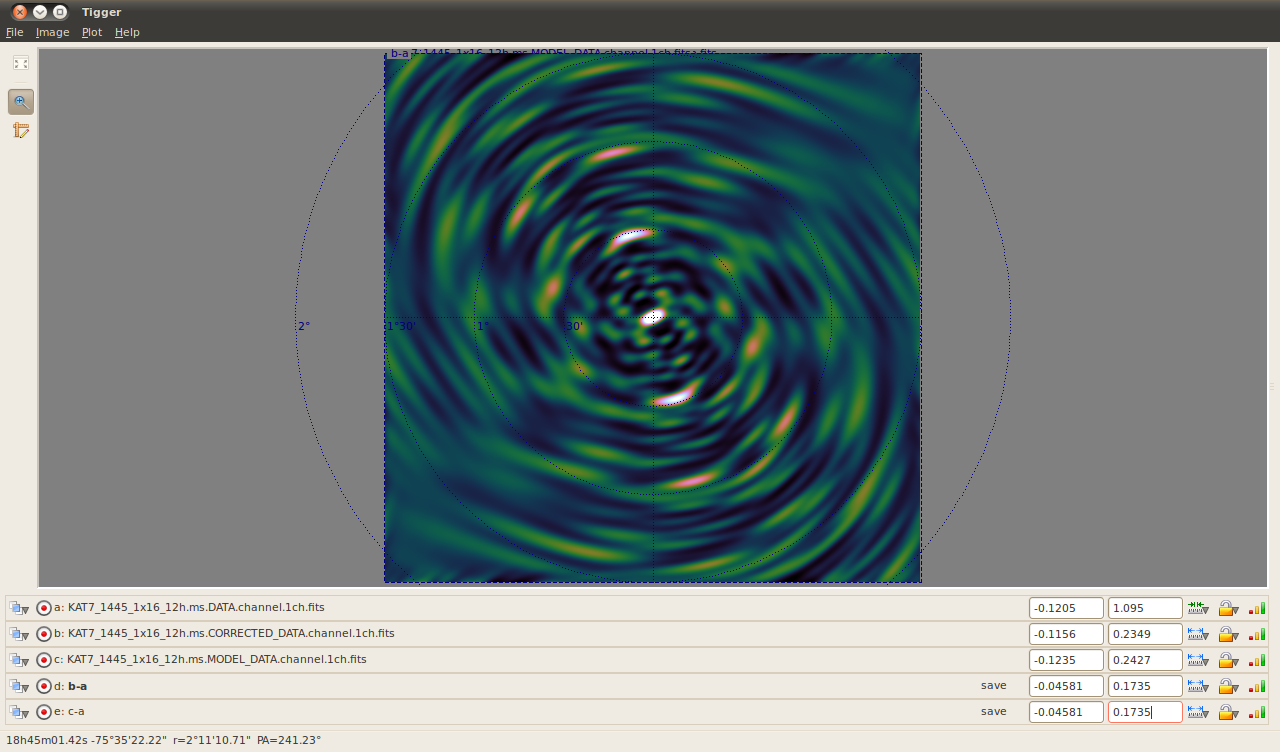
Again I've made some difference images in Tigger using the images formed from each column in the MS. This makes it easier to see. The screenshots below show CORRECTED minus DATA and MODEL minus DATA, showing how each individual flare adds extra bright regions to the sidelobes of this source.
|
|
|||||||||||||||
KAT7_1445_1x16_12h.ms.CORRECTED_DATA.channel.1ch.fits (header) | ||||||||||||||||
|
|
|||||||||||||||
|
|
|||||||||||||||
 |
||||||||||||||||
 |
||||||||||||||||