1218-460 1218-460
Logged on 03/08/10 14:42:52
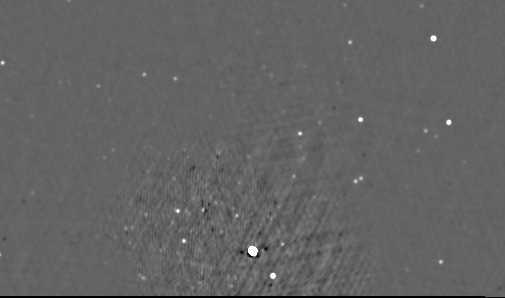
This source isn't covered by NVSS so we'll have to have a look at the field using SUMSS at 843 MHz. I've used a script to process the SUMSS catalogue and extract all the sources > 50 mJy in a 3 x 3 degree square patch of sky centred on 1218-460.
An hms-dms format LSM file and a Karma annotation file are attached below. It seems like the source finder has picked up a load of the residual junk around 1218-460 (see the picture) and added it to the catalogue, so it might be worth excising these sources from the LSM.
The reference frequency is 843 MHz in the LSM and I've given every source a spectral index of -0.7, which is obviously a pretty crap assumption.
|
|
|||||||||||||||
 |
||||||||||||||||
1218-460 addendumLogged on 03/08/10 14:45:33
[THIS IS NOW ON THE BUGZILLA]
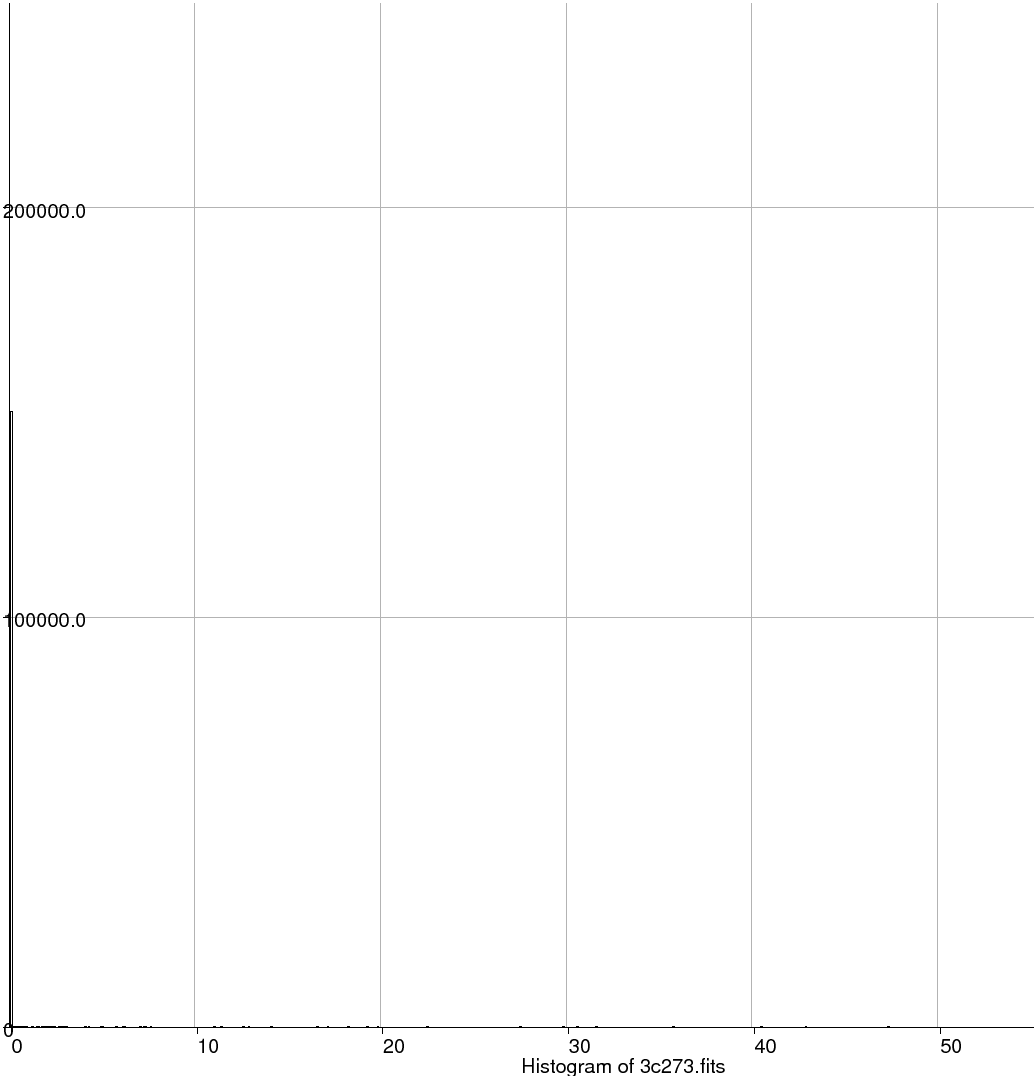
It doesn't look like the PURR FITS renderer likes the blanked values in the map I extracted from the SUMSS postage-stamp server, so consider this a bonus bug report!
Error rendering histogram /home/ianh/Desktop/KALIBRATORS/purrlog/entry-20100803-144252/1218-460-SUMMS.fits.purr-products/0-hist-full.png Traceback (most recent call last): File "/home/ianh/Purr/Purr/Plugins/fits.py", line 251, in regenerate self._make_histogram(hf_path,"Histogram of %s"%title,edges,counts); File "/home/ianh/Purr/Purr/Plugins/fits.py", line 119, in _make_histogram ar.draw(canv); File "/home/ianh/Purr/Purr/Plugins/local_pychart/area.py", line 200, in draw self.x_grid_interval) File "/home/ianh/Purr/Purr/Plugins/local_pychart/area.py", line 179, in __get_data_range dmin, dmax, interval = coord.get_min_max(dmin, dmax, interval) File "/home/ianh/Purr/Purr/Plugins/local_pychart/linear_coord.py", line 34, in get_min_max interval = 10 ** (float(int(math.log(dmax-dmin)/math.log(10)))) ValueError: cannot convert float NaN to integer Error rendering histogram /home/ianh/Desktop/KALIBRATORS/purrlog/entry-20100803-144252/1218-460-SUMMS.fits.purr-products/0-hist-zoom.png Traceback (most recent call last): File "/home/ianh/Purr/Purr/Plugins/fits.py", line 293, in regenerate self._make_histogram(hz_path,"Histogram zoom of %s"%title,edges[ih0:ih1],counts[ih0:ih1]); File "/home/ianh/Purr/Purr/Plugins/fits.py", line 119, in _make_histogram ar.draw(canv); File "/home/ianh/Purr/Purr/Plugins/local_pychart/area.py", line 200, in draw self.x_grid_interval) File "/home/ianh/Purr/Purr/Plugins/local_pychart/area.py", line 179, in __get_data_range dmin, dmax, interval = coord.get_min_max(dmin, dmax, interval) File "/home/ianh/Purr/Purr/Plugins/local_pychart/linear_coord.py", line 34, in get_min_max interval = 10 ** (float(int(math.log(dmax-dmin)/math.log(10)))) ValueError: cannot convert float NaN to integer
3C273Logged on 03/08/10 16:24:39
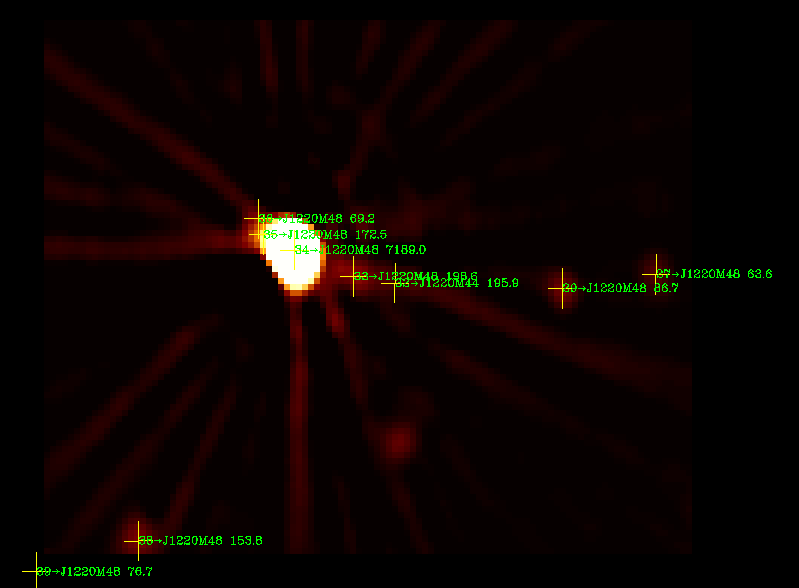
A sky model for 3C273 in hms-dms format is attached below, generated from the NVSS catalogue, again with a 3 x 3 degree square patch of sky, but this time with a 30 mJy flux cut off.
Also attached are a FITS image from the NVSS Postage Stamp Server and a kvis annotation file.
|
|
|||||||||||||||
3C273 addendumLogged on 03/08/10 16:28:06
Once again there's a strip of blank pixels in this FITS image but this time they're at the lower edge. Funnily enough Purr is happy to render this FITS file without complaint, although the stats are messed up by the NaNs.
I'll try to remember to add this message and the FITS image to the Bugzilla when I'm on a trusted IP tomorrow.
Centaurus ALogged on 08/08/10 00:01:12
RA = 13h 25m 27.615s Dec = -43d 01m 08.8053s
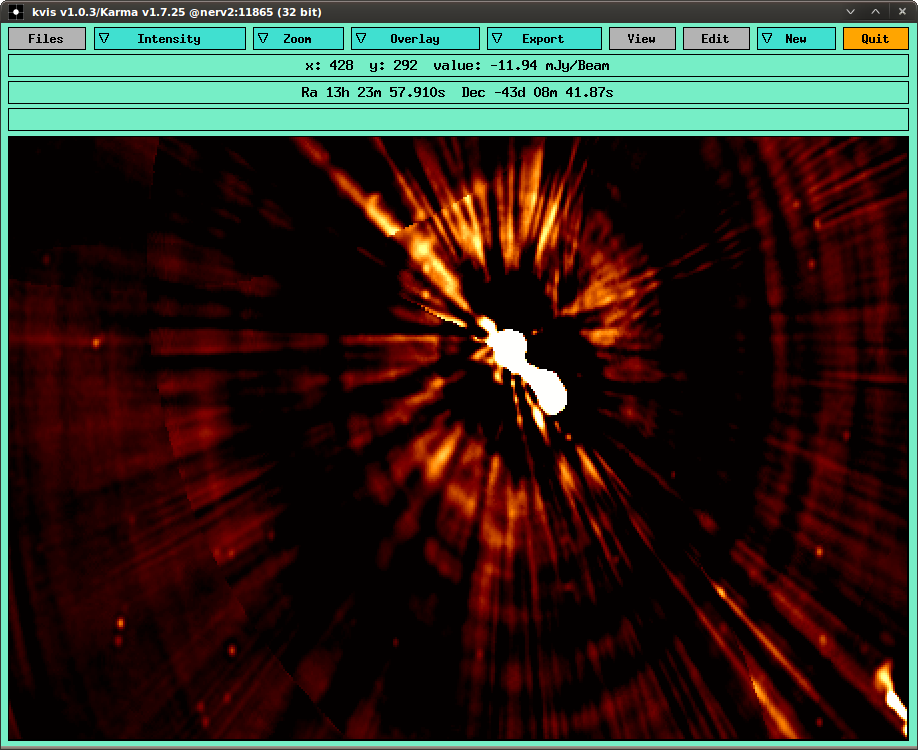
Extracted a sky model from SUMSS at 843 MHz. The FITS image is as messy as you'd expect for something as bright as Cen A.
Overlaying the annotations file shows a fair number of sources from the catalogue which aren't obvious in the image. I'm not sure if the SUMSS guys subtracted a model of Cen A (or something) before they ran the source finders.
I think in any case Cen A will be so dominant that the fainter sources won't matter so much...
|
|
|||||||||||||||
Cen A screen shotLogged on 08/08/10 00:04:55
Again the FITS renderer doesn't like the blanked pixels, so here's a screen shot:
 |
 This log was generated
by PURR version 1.1.
This log was generated
by PURR version 1.1.